
AER applications are leading indicators of industry activity
 AER applications are a leading indicator of industry activity. When applications are up over last month, it usually means increased industry activity will follow.
AppIntel is the only way to watch these trends.
Statisticians say a leading indicator is a measurable factor that preceeds a change in the economy. For example, building permits are a leading indicator of construction activity. If building permits are up in a month, it likely means that construction activity will increase over the next few months.
Just like economic leading indicators, AER application submissions are a leading indicator of oil and gas activity.
When well licence applications increase, more wells will be drilled in the next twelve months.
When down-spacing or holding applications ramp up, that's even an earlier indicator that those applicants will be drilling more wells over the next two years.
When pipeline licence applications spike, more pipelines will be laid over the next few quarters.
When more oil sands commercial scheme applications are registered, more oil sand related construction will occur over the next five years.
Applications are not just an leading indicator of industry activity, but also of individual company activity. Often a junior oil company press releases state that they have made application to the AER to drill wells or to build facilities. They are trying to tell their prospective investors that increased activity and prosperity lie ahead.
Since 2015 was one of the largest years ever for pipeline licence applications, this likely means that many pipelines will be constructed this year -- good news for the pipeline construction service sector.
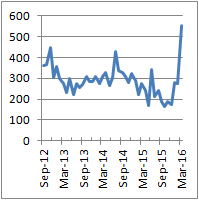 Watching applications volume can reveal important trends. Last month, more resource applications were submitted that any other month in the last four years. We found this information from AppIntel.
What does this leading indicator say about our industry -- or about the single company responsible for the sudden increase in applications?
AppIntel allows you to watch application trends. There is no other source for this information.
In AppIntel, you can check out trends of applications submitted, of applications refused, and of application approval times. You can watch applications submitted in an area, or the volume of applications submitted by a competitor.
Call for a demo today. See how AppIntel can help you predict the future of the oil industry.
Tags: AppIntel advantage
 Granger Low 14 Apr 2016


You don’t know what you don’t know about injection water treatment
AppIntel AI fixes that

Polymer - hot and salty
High pressure, high temperature, high salinity

Replace your in-house wiki with AI
Better than any other LLM

Inspire your facility intelligence
AppIntel AI shows you the industry’s design innovations

Evade obsolete careers with AppIntel AI
Keep up on tech advances like gas huff-n-puff in heavy oil

Using AppIntel AI for competitive intelligence
Email alert when new oil field plans are made within 20 miles of you
 Calgary, Alberta, Canada
 Share
Share